
 EN
EN

What Metrics Should You Track to Measure Redemption Game Performance Beyond Coin Drop?
Coin drop is a useful starting point, but it is not a complete verdict on a redemption game. A machine can collect strong revenue while creating too much ticket liability, consuming staff time, suffering repeat faults, or failing to bring guests back to the prize counter. Conversely, a game with moderate coin drop may be a valuable traffic builder when it has high repeat play, supports a healthy prize mix, and helps guests stay longer in the venue.
For arcade and family entertainment center operators, the aim is not simply to identify the highest-grossing cabinet. The aim is to understand which redemption game earns durable contribution, creates a satisfying player experience, and deserves its floor space. A practical scorecard makes that decision easier.
Start With Coin Drop, Then Put It in Context
Track gross coin drop by machine, by daypart, by day of week, and by location on the floor. Those cuts reveal whether a result comes from a genuinely compelling game or from a favorable placement near the entrance, queue, or prize counter. Compare the same periods after adjusting for opening hours and special events.
Then calculate revenue per available operating hour: coin drop divided by the hours the machine was available to play. This stops a game with limited uptime from looking better than it is. A cabinet that earns well only during a busy two-hour window may need a different intervention than one that produces steady revenue throughout the day.
Measure Utilization and Player Throughput
Utilization answers a simple question: how much of the time could the machine have been earning, and how much of that time was it actually in use? Where card-system data is available, estimate it as occupied play time divided by available operating time. For cashless systems without detailed session logs, use play counts and the average game cycle to create a consistent proxy.
Pair utilization with plays per operating hour and average session length. High plays with short sessions may indicate an accessible, fast-turn game that works well in a crowded redemption zone. Longer sessions can be positive, but they may also reduce throughput if a single player holds the station during peak traffic. Neither pattern is automatically good or bad; the right interpretation depends on floor congestion, guest mix, and the game’s role in the zone.
Track Repeat Play and Completion Behavior
Coin drop cannot tell you whether guests chose a game once or returned to it. Repeat play rate—repeat sessions divided by unique players, where the system can identify them—is a stronger engagement signal. It helps distinguish a game that attracts curiosity from a redemption game that encourages players to try again.
Also watch completion, abandon, and error-interruption rates. If a machine shows frequent abandoned plays, observe it on the floor before changing settings. The cause may be an unclear rule, a poorly visible target, a difficult control, a prize display that does not motivate the player, or a technical interruption. A small sign, a control adjustment, or a maintenance fix can improve the experience more effectively than a broad payout change.
Manage Ticket Payout as an Economic Metric
Ticket payout should be measured both per play and as a percentage of revenue. A useful first calculation is tickets issued divided by plays; a second is the estimated redemption cost of those tickets divided by machine revenue. The second measure matters because tickets are a liability until they are redeemed, and the actual cost depends on the prize mix rather than on ticket count alone.
Review payout distribution, not just the average. A redemption game with a volatile payout pattern can create guest excitement, but it can also create surprise costs or an inconsistent perception of fairness. Look for sudden shifts after software changes, setting adjustments, or maintenance work. Keep an approved baseline for each game so that operators can recognize a true performance change rather than reacting to a single busy weekend.
Connect the Game to Prize-Counter Performance
A healthy game zone and a healthy prize counter work together. Track ticket redemption rate, time from ticket issue to redemption, and the categories guests choose when they redeem. If a game produces high ticket volume but tickets are rarely redeemed, the venue may be building liability without delivering a satisfying reward moment.
Prize velocity is another useful operational measure: how quickly key prize categories move relative to the tickets required to win them. Slow-moving prizes can signal weak perceived value; rapid depletion can signal a pricing or replenishment issue. Review game settings and prize counter data together before deciding a redemption game is underperforming.
Calculate Contribution, Not Just Revenue
For every machine, estimate contribution after the costs directly tied to operating it: prize cost, card or payment fees where relevant, repair parts, service labor, and a sensible share of power and floor-space cost. You do not need an exhaustive accounting model to make better decisions. A consistent estimate is enough to compare machines and identify where investigation is worthwhile.
Use contribution per square foot or per square meter for larger cabinets. This is particularly important in compact locations, where a visually impressive machine must earn its footprint. A lower-revenue game may still be worth keeping if it has excellent contribution per area, draws families, or balances a zone dominated by high-intensity skill games.
Make Uptime and Service Data Part of the Scorecard
A redemption game that is out of service during peak hours loses more than immediate revenue. It can disrupt guest trust and add pressure to staff. Record uptime, fault count, mean time between service calls, mean time to repair, and recurring fault categories. Separate player-facing failures from routine preventive tasks so the report shows what guests actually experienced.
Review these metrics with your supplier and service team. ACE Amusement’s portfolio includes redemption machines and other arcade equipment, but informed operating decisions should rely on site-specific play, payout, and service data rather than a generic revenue promise.
Build a Weekly Decision Routine
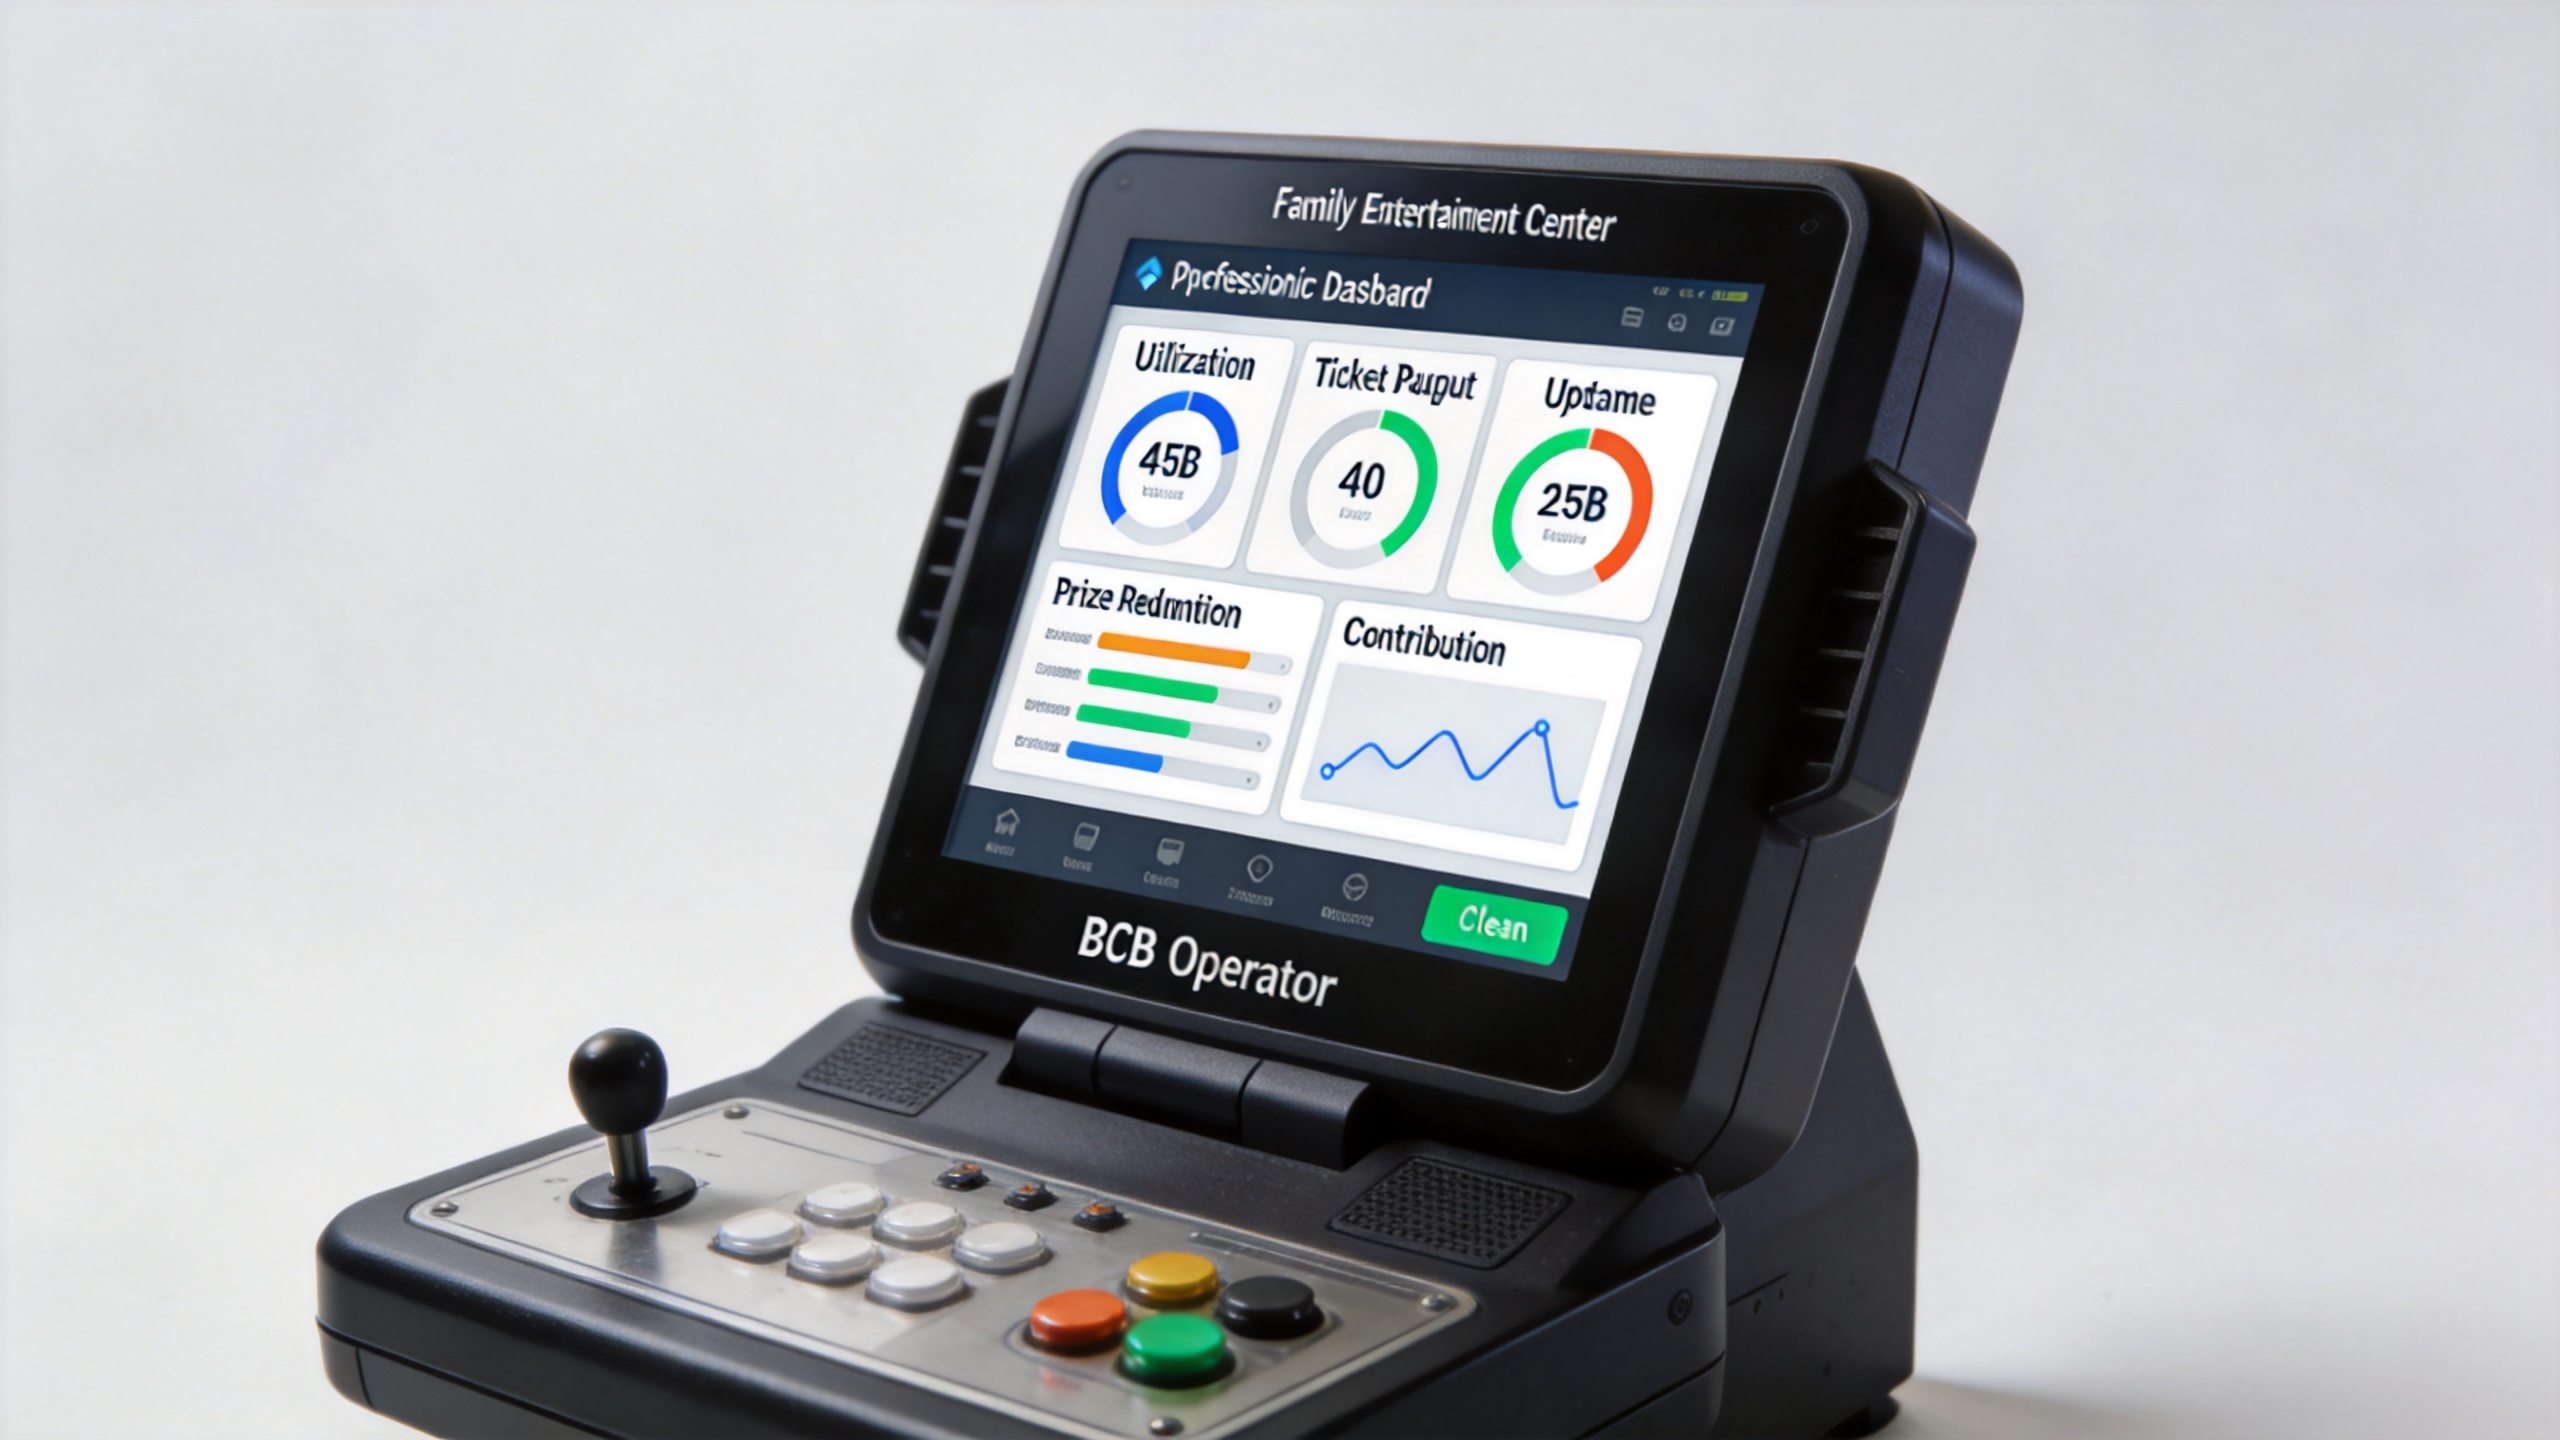
Use one dashboard for a weekly review: coin drop, revenue per available hour, utilization, plays per hour, repeat play, ticket cost as a share of revenue, redemption behavior, contribution, uptime, and service events. Flag material changes against the machine’s own recent baseline, then observe the game in person before taking action.
- High revenue, weak contribution: review payout settings and prize economics.
- Low utilization, good guest feedback: test placement, signage, or visibility.
- High repeat play, low ticket redemption: inspect prize appeal and ticket-to-prize thresholds.
- Strong coin drop, frequent faults: prioritize reliability before expanding the game’s role.
The most useful redemption game metric is not a single number. It is a connected view of demand, player experience, prize economics, and reliability. When operators track those relationships, they can improve settings, placement, maintenance, and product mix with more confidence than coin drop alone can provide.
Use a Consistent Redemption Game Scorecard
Apply the same redemption game scorecard every week. For each redemption game, record revenue, plays, uptime, tickets issued, and prize cost. Compare each redemption game with its own four-week baseline before comparing it with another redemption game. This keeps a fast redemption game, a high-skill redemption game, and a family redemption game from being judged by one narrow standard.
In the review, ask five questions for every redemption game: Is the redemption game available when guests want to play? Does the redemption game convert curiosity into repeat plays? Does the redemption game issue tickets at an intentional rate? Does the redemption game support prize redemption? Does the redemption game retain enough contribution after direct costs? A redemption game that misses one question may need a small operational change; a redemption game that misses several needs closer observation.
| Redemption game signal | What to review | Possible next step |
|---|---|---|
| Redemption game utilization | Plays and availability | Check placement |
| Redemption game repeat play | Return sessions | Observe rules and controls |
| Redemption game payout | Tickets and prize cost | Review settings |
| Redemption game uptime | Faults and repair time | Schedule service |
| Redemption game contribution | Revenue after direct cost | Protect floor space |
Do not change a redemption game because of one unusual shift. Look for a pattern in the redemption game data, watch guest behavior, and document the adjustment. The next review then shows whether the redemption game improved because of the change rather than because traffic happened to rise.
Define each redemption game metric consistently across the venue. Log redemption game availability before counting plays, and separate a redemption game closure from scheduled cleaning. This makes the redemption game report useful for operations and prize-counter teams.
When a redemption game is moved or retuned, tag the date in the dashboard. Compare the next redemption game review with utilization, payout, and repeat-play movement. A redemption game scorecard should inform experiments, not replace staff observation. Review each redemption game at the same weekly meeting, and retain the record when a redemption game setting changes.


 Hot News