
 EN

What Prize-to-Cost Ratio Maximizes Player Satisfaction and Operator Profit?
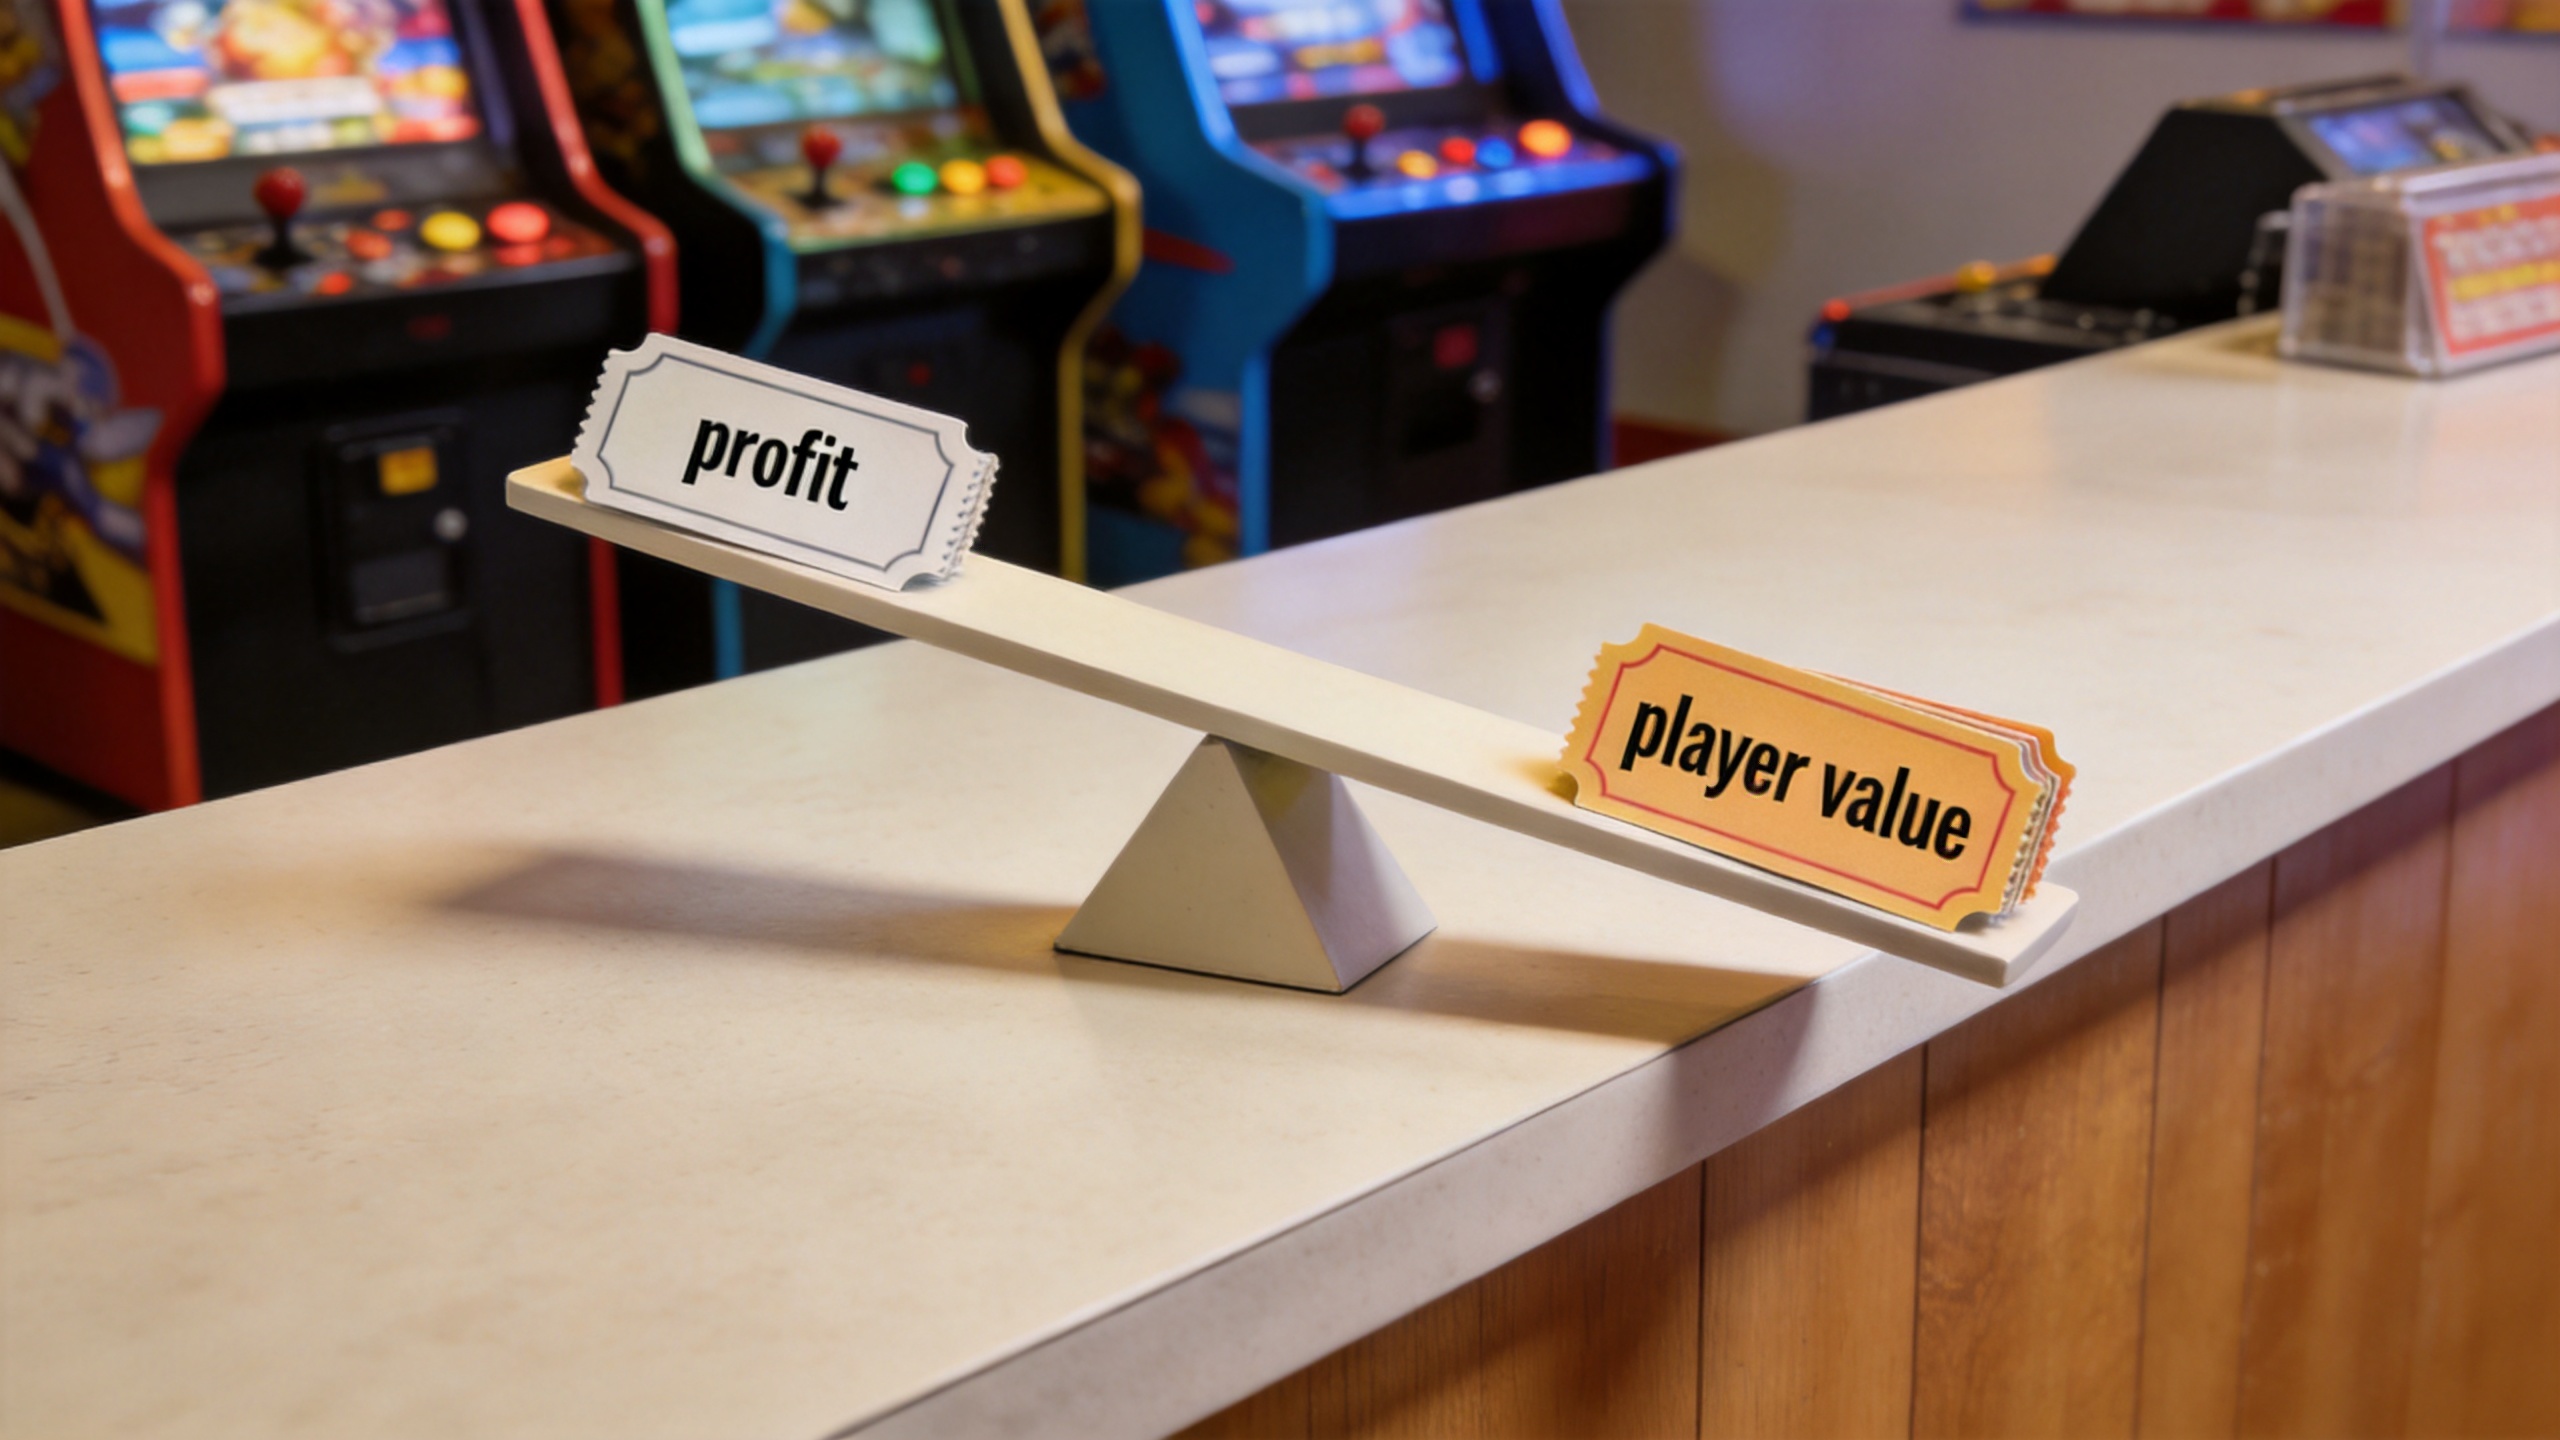
For an arcade operator, a prize game is not simply a cabinet that issues tickets. It is a promise: a player puts in time and money, sees their balance grow, and expects that balance to lead to a reward that feels worthwhile. The operator has a parallel promise to keep—cover prize cost, labor, rent, maintenance, and future reinvestment. The useful question is not “What is the highest payout we can afford?” It is “What prize value keeps the experience credible enough to bring players back while leaving a workable margin?”
There is no universal setting for every prize game. An arcade hall operator should begin with a controlled target range, measure what happens on the floor, and adjust by game category, audience, and prize mix. In many redemption operations, an actual prize cost near 18% to 24% of redemption-game revenue is a sensible starting hypothesis to test. It is a planning range, not a promise: a venue with high rent, a family audience, premium merchandise, or a low game price may need a different result.
Start With Actual Prize Cost, Not Shelf Price
The ratio that matters is the cost of redeemed prizes divided by the revenue produced by the relevant prize game—or, for a broader view, by the redemption-game bank. Use landed cost, including shipping, duties, breakage, and the handling needed to place an item in the redemption counter. A prize marked at a high retail price may still have a modest landed cost; the opposite can also be true.
Prize-cost ratio = total tickets issued × actual cost per ticket ÷ game revenue.
For example, imagine a prize game that produces $1,000 in play revenue during a review period. If its ticket issue converts into $220 of actual redeemed merchandise cost, the prize-cost ratio is 22%. That figure is more useful than looking at tickets alone because it turns ticket payout into a cost that can be compared with revenue. It also lets the team see whether a change to settings or the prize wall changed the economics.
Keep the calculation separate from cabinet depreciation, card-system fees, technician time, and fixed venue costs. Those expenses still matter when judging profit, but isolating prize cost first makes the player-value conversation much clearer.
Why Players Judge Value Differently Than Operators
Players do not calculate landed cost per ticket. They notice whether the prize counter looks attainable, whether there are meaningful steps between small and aspirational items, and whether a session leaves them closer to a reward. A prize game can have a low cost ratio and still feel unrewarding if ticket balances move slowly or the entry-level choices appear weak.
That is why a good redemption design separates perceived value from cost. A compact, visibly desirable item at a reachable ticket level can create more satisfaction than a costly item hidden at the top of the wall. Conversely, filling the counter with only low-ticket fillers can make every game feel like a poor trade, even when the payout spreadsheet is comfortably below target.
Watch player behavior as well as numbers. Players clustering around visible reward mechanics, groups comparing ticket balances, and repeat attempts near a target are useful signals that the prize game feels engaging. Complaints about “needing too many tickets,” abandoned cards with small balances, or a quiet redemption counter are signals to investigate—not proof that every machine needs a larger payout.
A Practical Starting Range: 18%–24%
For many family entertainment centers, an 18%–24% actual prize-cost ratio is a useful operating band to test. The lower end may suit high-volume games with strong entertainment value, modest fixed costs per play, and a prize counter that offers attractive attainable choices. The higher end may be appropriate for games designed to create repeat play, for venues using redemption as a major traffic driver, or for periods when a refreshed prize assortment is needed.
| Observed ratio | What it may indicate | What to check next |
|---|---|---|
| Below 18% | Margin protection is strong, but player value may be weak. | Review attainable prizes, ticket velocity, repeat-play rate, and redemption-counter feedback. |
| 18%–24% | A workable starting zone for many prize game programs. | Compare performance by game type and validate that satisfaction signals remain healthy. |
| Above 24% | Players may be receiving more value, but prize expense can compress contribution. | Check settings, high-cost prize redemptions, supplier costs, and whether extra play offsets the expense. |
Do not apply one number mechanically to every cabinet. A skill-forward game, a large-ticket attraction, and a small children’s game may serve different jobs on the floor. One machine can be a traffic driver; another can be a steady revenue contributor. The right mix may include a few more generous experiences that support a healthy overall prize-cost ratio across the redemption zone.
Use a Prize Ladder Instead of One Expensive “Hero” Reward
A balanced prize game program gives players several ways to feel progress. Build a ladder with low-ticket items that are genuinely appealing, mid-tier rewards that encourage another session, and a limited set of aspirational prizes that make the counter visually interesting. The purpose is not to make every item cheap; it is to make each ticket balance feel usable.
- Entry level: Include items that a casual player can reach in one or two visits.
- Mid tier: Stock rewards that turn a partial balance into a reason to return.
- Aspiration: Use visible, carefully costed items to give regular players a longer-term goal.
- Rotation: Refresh slow-moving items and record actual cost changes before they distort the ratio.
This layered approach helps avoid a common mistake: high-ticket redemption prizes can look impressive, yet they may reduce loyalty if most players see no realistic path toward them. A prize game earns repeat play when the journey feels fair, not when the display contains the most expensive object.
Test the Ratio With Controlled Changes
Set a baseline before changing payout settings or the prize mix. Track revenue, tickets issued, actual redeemed cost, plays per card, repeat visits where your system can identify them, and redemption-counter comments. Then change one meaningful variable at a time: perhaps revise the ticket setting on a single game category, introduce a stronger mid-tier prize, or reprice a high-cost item after a supplier change.
Give the test enough time to include normal traffic patterns. Weekend-only observations can be misleading, especially when family groups, birthday parties, and regular players behave differently. Compare the new period with the baseline and ask two questions: did prize cost rise or fall as expected, and did player engagement change enough to justify that movement?
In practice, the answer may be a narrow adjustment rather than a dramatic reset. If a prize game sits at 15% cost but has weak repeat play, moving it toward 19% through a better ticket ladder may improve the experience without damaging the overall program. If another game reaches 28% with no engagement lift, the remedy may be a setting review or a smarter prize substitution rather than more marketing.
Protect Profit Beyond the Payout Setting
Prize cost is only one part of operator profit. Reliable equipment, sensible floor placement, fast repair response, and a prize assortment that fits the audience affect the result. A popular game that is out of service during peak hours loses revenue regardless of its ticket setting.
ACE Amusement works across arcade machines, redemption machines, video simulator games, and amusement rides, allowing operators to consider each prize game as part of a floor mix. Before setting a payout target, assess the expected audience, traffic flow, service support, and the role of each cabinet.
Conclusion: Optimize Trust, Then Measure the Margin
The prize-to-cost ratio that maximizes satisfaction and profit is usually not the lowest possible payout or the most generous one. For many venues, test an 18%–24% actual prize-cost range, build a prize ladder that makes progress visible, and review player behavior beside the spreadsheet. A fair-feeling prize game encourages another play; a disciplined measurement process keeps that experience financially sustainable.
A Weekly Prize Game Review Routine
To keep a prize game program under control, review a short set of numbers every week. List each prize game, its play revenue, tickets issued, estimated actual prize cost, downtime, and any change in the prize mix. Then group the prize game results by category rather than reacting to one unusual day. A reliable high-volume prize game may support a leaner ratio when its entertainment value is obvious, while a new or highly visible prize game may justify a modestly higher ratio during a measured trial.
Pair that spreadsheet with an observation log. Note which prize game attracts a queue, which prize game players leave after one attempt, and which rewards are requested or ignored at the counter. The goal is to connect ratio changes to a real player response. If a revised prize game setting increases repeat plays and keeps actual prize cost inside the venue target, retain it. If a revised prize game only increases cost without changing behavior, reverse the test and examine the prize ladder instead.
Use the ratio as a management tool, not a fixed rule. When the player experience remains credible and the full redemption program supports its costs, the operator has found a healthier balance.


 Hot News
